
What Is Productivity Analytics? A Practical Guide for Modern Businesses
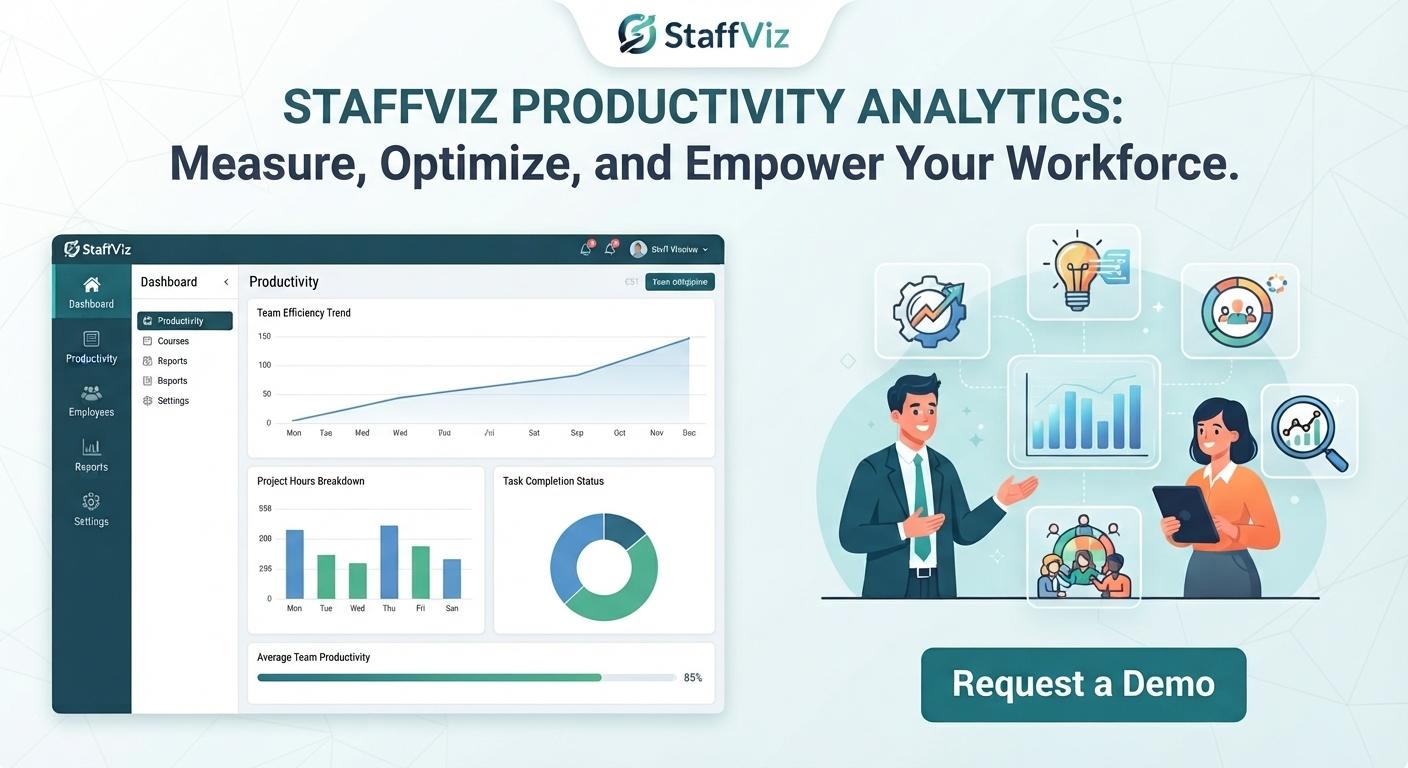
Businesses today have access to more workforce data than ever before, but collecting information is only the beginning. Organizations need to understand what that information means and how it can support better decisions. This is where productivity analytics becomes valuable.
Productivity analytics involves collecting and analyzing information related to employee work patterns, time usage, tasks, projects, and performance. Instead of relying entirely on assumptions about how teams are performing, managers can use relevant data to identify trends, recognize inefficiencies, and understand where improvements may be needed.
When used responsibly, productivity analytics can help organizations improve workflows while giving employees and managers a clearer picture of how work is being completed.
Understanding Productivity Analytics
Productivity analytics is the process of examining workforce and operational data to understand how effectively time, resources, and effort are being used.
The information analyzed can vary depending on the organization. It may include time spent on projects, task completion, attendance, overtime, idle time, project performance, and other relevant productivity indicators.
For example, a company may discover that a particular project consistently takes longer than expected. Instead of assuming that employees are working inefficiently, managers can examine the available data to determine whether the problem is unrealistic deadlines, excessive administrative work, unclear responsibilities, or resource limitations.
This makes productivity analysis more useful than simply counting hours worked.
Why Businesses Need Productivity Analytics
Making Decisions Based on Real Data
Managers often have limited visibility into how work happens throughout the day, especially when teams operate remotely or across multiple locations. Productivity analytics can provide additional context.
Suppose a marketing team reports that a campaign is taking longer than planned. Managers can examine project data, task timelines, and workload patterns to understand where delays are occurring. The goal is not necessarily to identify an individual who is responsible, but to understand what is affecting the workflow.
Data can therefore support more informed management decisions.
Identifying Workflow Inefficiencies
Businesses can also use analytics to identify processes that consume unnecessary time. Repetitive administrative activities, excessive meetings, unclear workflows, and uneven workloads can all affect productivity.
Once a pattern becomes visible, managers can investigate possible solutions. A process might be simplified, responsibilities could be redistributed, or certain repetitive activities could be automated.
How Employee Productivity Analytics Works
Employee productivity analytics generally starts with collecting relevant workforce information. Depending on the organization and technology being used, this may include working hours, project time, task activity, attendance, performance data, and other operational indicators.
The next step is analyzing the information to identify meaningful patterns. A single day's data rarely provides enough context to make a useful conclusion. Trends across weeks or months can provide a better understanding of recurring challenges.
For example, if an employee occasionally works overtime, that may simply reflect a busy period. If an entire team consistently works excessive overtime, however, management may need to investigate workload distribution or project planning.
Context is essential when interpreting productivity data.
Important Metrics Businesses Can Track
Time and Workload Patterns
Time data can help managers understand how much effort different projects or tasks require. Comparing estimated project time with actual time can reveal whether deadlines and resource allocations are realistic.
Workload information can also help identify teams that may be handling significantly more work than others.
Project and Task Performance
Project productivity metrics can provide insight into how efficiently teams complete assigned work. Managers can compare project timelines, task completion, and resource usage to identify potential bottlenecks.
For instance, if one stage of a project repeatedly causes delays, management can examine that stage rather than assuming that overall team performance is the problem.
Overtime and Idle Time
Overtime can indicate periods of increased demand, but consistently high overtime may suggest workload or planning issues. Similarly, unusual idle time patterns may warrant further investigation.
These metrics should always be interpreted carefully. A productivity number without context can easily lead to the wrong conclusion.
Workforce Productivity Analytics for Remote and Hybrid Teams
Remote and hybrid work have made workforce visibility more challenging for some organizations. Managers cannot always observe how employees spend their working hours, and traditional office based management practices may not provide enough information.
Workforce productivity analytics can help provide a more structured view of work patterns across distributed teams.
For example, a manager may notice that a remote team is consistently missing project deadlines. Instead of immediately assuming that employees are disengaged, the manager can review workload, task distribution, project timelines, and collaboration patterns to identify possible causes.
Using Productivity Data Without Micromanagement
Analytics should support employees rather than create unnecessary pressure. A common mistake is treating every productivity metric as a measure of individual performance.
Employees may spend time in meetings, planning, research, training, collaboration, or problem solving that is not immediately reflected in simple activity measurements. A person who appears less active on a particular day may still be making an important contribution.
Managers should therefore combine quantitative information with conversations, project outcomes, employee feedback, and professional judgment.
The best use of analytics is to ask better questions. If data reveals that a team is spending excessive time on a process, managers can investigate why and work with employees to improve it.
Turning Analytics Into Action
Collecting productivity data is not enough. Businesses need to turn insights into practical improvements.
If analytics reveals that employees spend significant time on repetitive tasks, automation may help. If workload data shows that certain employees are consistently overloaded, responsibilities may need to be redistributed. If project data reveals repeated deadline problems, managers may need to revisit planning and resource allocation.
This creates a continuous improvement cycle in which organizations measure performance, identify patterns, make changes, and evaluate the results.
Conclusion
Productivity analytics gives modern businesses a structured way to understand workforce performance, time usage, project activity, and operational efficiency. When interpreted in context, it can help managers identify workflow problems, improve resource planning, support distributed teams, and make more informed decisions.
The goal should not be to monitor every employee action or reduce productivity to a single number. Instead, businesses should combine workplace productivity metrics with employee feedback, project outcomes, and thoughtful management practices.
FAQs
What is productivity analytics in the workplace?
Productivity analytics is the process of collecting and analyzing workforce data to understand how employees, teams, projects, and resources are performing and where efficiency can be improved.
How does employee productivity analytics help businesses?
It can help businesses identify workflow inefficiencies, understand workload patterns, evaluate project performance, monitor relevant time data, and make more informed operational decisions.
What metrics are used in productivity analytics?
Common metrics can include working time, project time, task completion, attendance, overtime, idle time, project performance, and other organization specific performance indicators.
Can productivity analytics be used for remote employees?
Yes. Productivity analytics can help remote and hybrid organizations understand work patterns and project performance when managers have less direct visibility into daily operations.
Does productivity analytics mean employee monitoring?
Not necessarily. Productivity analytics can focus on projects, workloads, processes, and team performance. Responsible organizations use data as a source of insight rather than relying on monitoring alone.
How can companies improve productivity using analytics?
Companies can analyze performance patterns to identify bottlenecks, redistribute workloads, improve processes, automate repetitive tasks, adjust project planning, and provide targeted support.
What is the difference between productivity analytics and time tracking?
Time tracking primarily records how working time is spent, while productivity analytics can combine time information with project, task, workload, and performance data to provide broader insights.
Why is context important when analyzing employee productivity?
A productivity metric by itself may not explain why a particular pattern occurred. Combining data with project requirements, employee responsibilities, workload, and communication provides a more accurate understanding of performance.

 Arabic
 French
 Spanish
 Portuguese
 Deutsch
 Turkish
 Dutch
Dutch
 Italiano
 Russian
 Romaian
 Portuguese (Brazil)
 Greek
Greek